Over the years, we have seen the USDA food graphic evolve. The evolution of this graphic speaks a lot to living an intuitive eating lifestyle. The old graphic used to break down the food groups into how many servings of each group you should eat each day. Servings were not defined, so you were forced…

A Comparison between the Evolution of the Food Graphic and the Intuitive Eater’s Journey
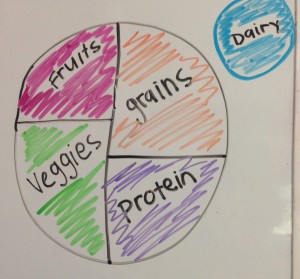
Read More ...
A Healthy Facelift for the School Lunch Program
It’s been estimated that nearly 32 million children eat lunch and 11 million eat breakfast each day in school. Overall, about 30%-50% of kid’s daily calories are consumed in school. It is crucial that they receive nutritious options to promote healthy lifestyle behaviors, as well as proper nutrition for optimal learning in the classroom. For…